Contact: Anna Cook, Head of Communications (anna.cook@nea.org.uk) Mobile: 07884 371913
- New Government data released today shows the impact of fuel poverty regionally but two-year time lag on the data means it doesn’t include the worst impacts of the energy crisis
- Birmingham has the highest total number of households living in fuel poverty, replacing Wolverhampton.
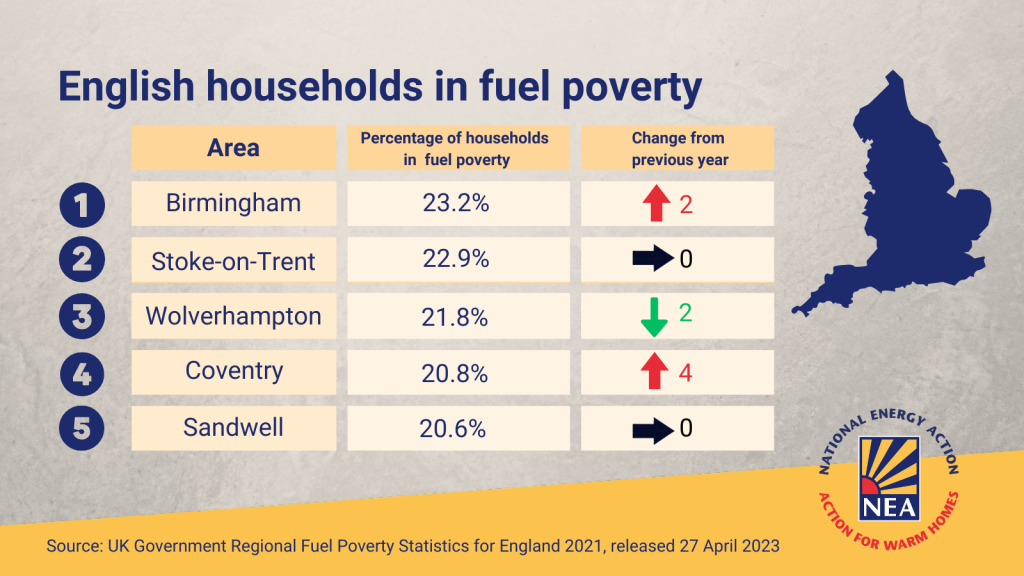
- Birmingham also has the greatest proportion of households in fuel poverty with 23.2% unable to stay warm and safe at home, followed by Stoke-on-Trent
Today, the UK Government releases new data showing fuel poverty regionally in England.
New analysis by fuel poverty charity National Energy Action (NEA) reveals Birmingham has the highest total number of households living in fuel poverty and the greatest proportion of households.
Birmingham now has 23.2% of households in fuel poverty (was 21.8%), followed by Stoke-on-Trent with 22.9% (was 22.1%).
However, the data only tells part of the story. There is still a two-year lag for sub-regional data. It only goes up to December 2021, yet energy prices only started to rise in October 2021. Since then, typical energy bills have almost doubled in a year – going from £1,271 for typical users to £2,500. This means the data does not show the worst impacts of the energy crisis.
The data shows the five areas with the highest percentage of households living in fuel poverty in 2021 were:

| Area | % | Rank last year |
| 1.Birmingham | 23.2% | 3 |
| 2. Stoke-on-Trent | 22.9% | 2 |
| 3. Wolverhampton | 21.8% | 1 |
| 4. Coventry | 20.8% | 8 |
| 5. Sandwell | 20.6% | 5 |
Adam Scorer, chief executive of National Energy Action says:
‘Soaring energy prices and decreasing incomes have plunged millions more people into fuel poverty, unable to keep themselves comfortable and warm at home. Behind these figures are the stories of people we hear from every day. People in crisis, sacrificing hot meals or showers to afford a warm room, or forced to ration their energy despite it decimating their health. Yet, the two-year time lag on the data means we won’t know the full picture of the energy crisis until this time next year. The Government figures released today massively understate the current crisis.’
National Energy Action has updated its fuel poverty map so householders can find out how their area compares. Go to https://www.nea.org.uk/fuel-poverty-map/.
The data also shows the area with the highest fuel poverty by number is also Birmingham with 100,512 households (was 96,795), followed by Leeds with 55,274.
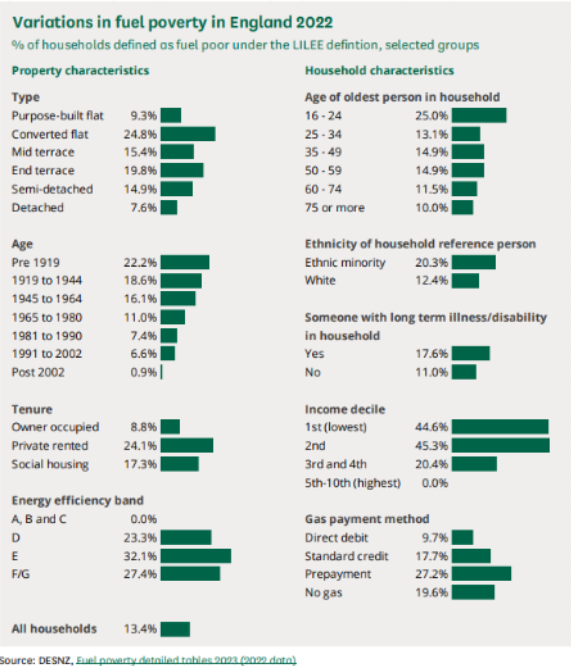
Fuel poverty in England is measured using the Low Income Low Energy Efficiency (LILEE) indicator. This takes into account household income, energy requirements and fuel prices but there are limitations with this definition. Those in homes with an EPC rating of C or above are not counted as fuel poor no matter their income or energy costs. Those most impacted by fuel poverty include people in privately rented homes, older, less energy efficient properties. People under 24 and those from ethnic minority backgrounds and in the lowest income decile are also disproportionately affected.
If this goes online please link to https://www.nea.org.uk/fuel-poverty-map/
If this goes on Twitter please include @NEA_UKCharity
ENDS
Notes to editors
- The Government data can be found here: https://www.gov.uk/government/statistics/sub-regional-fuel-poverty-data-2022
- Fuel poverty in England is measured using the Low Income Low Energy Efficiency (LILEE) indicator. Under this indicator, a household is considered to be fuel poor if: they are living in a property with a fuel poverty energy efficiency rating of band D or below and when they spend the required amount to heat their home, they are left with a residual income below the official poverty line. https://www.gov.uk/government/collections/fuel-poverty-statistics
- Go to https://www.nea.org.uk/fuel-poverty-map/ for the map and www.nea.org.uk/ XXXXX for the full list by region
- Our fuel poverty explainer, https://www.nea.org.uk/news/fuel-poverty-explainer, shows the limitations of the Government data
- The variations in fuel poverty are below. (Source DESNZ) – March 2023 House of Commons Library briefing https://www.gov.uk/government/statistics/fuel-poverty-detailed-tables-2022

6. The local elections are on XX May. We’re asking councillors to sign up to the Warm this Winter election pledges. You can find them here https://www.endfuelpoverty.org.uk/end-fuel-poverty-councillor-pledge/


