National Energy Action (NEA) Fuel Poverty Statistics Explainer
The purpose of this briefing is to provide some background to the fuel poverty statistics for the England, which are released by the UK Government on the 28th February. It also highlights why our UK prediction on fuel poverty levels is likely to diverge from the new published statistics.
Differences in measurement
UK legislation (i) defines a person as living in fuel poverty as “a member of a household living on a lower income in a home which cannot be kept warm at reasonable cost”. However, across the different nations, there are different ways to measure how many households fit this definition and measure progress. The table below highlights these different approaches.
| Nation | Measurement Used | Advantages | Disadvantages |
| England | Low Income, Low Energy Efficiency (LILEE).
Those households that have an income below the poverty line, living in a home with an EPC of worse than C are considered as being Fuel Poor. |
Good at capturing the progress of energy efficiency installations– when a fuel poor household reaches EPC C, they are no longer captured in the metric. | Energy prices have a minimal impact on the measure, because neither income, nor the EPC of a property, is related to the price of energy. |
| Wales, Scotland and Northern Ireland | Different variations of the ‘10%’ metric.
Households spending more than 10% of their income after housing costs are considered as being Fuel Poor. |
Sharply reacts to changes in energy prices, as they have a direct impact on the proportion of income spent on energy | Without an income cap (which is in place in Scotland), can include households in higher income deciles. |
Which measurement do National Energy Action use?
To provide a picture across the whole of the UK, National Energy Action estimates the number of households in fuel poverty based on the 10% measurement of fuel poverty. National Energy Action estimates that based on this approach, across the whole of the UK 6.7 million households are currently in fuel poverty, unable to heat and power their homes sufficient for their own comfort and well-being. Our projections are broadly in line with robust analysis by the Resolution Foundation surrounding ‘Fuel Stress’v, which is also based on the 10% fuel poverty metric.
On Monday 27 February, Ofgem released the new level of the price cap, to come into force in April. This will reach ~£3,300/year (ii) for the typical household. National Energy Action estimates that based on that estimate, and if the UK Government does not change its course and continues with plans to remove the Energy Bill Support Scheme and increase the Energy Price Guarantee, the typical household can expect an energy bill of £3000/year. NEA calculates this will result in increasing the number of fuel poor households to 8.4 million post April, again across the whole of the UK (iii). National Energy Action also calculates that if the Energy Price Guarantee was not in place in April, the number would be almost 9 million.
National Energy Action chief executive Adam Scorer says: “Ofgem’s cap announcement is moving in the right direction. It shows that wholesale prices are reducing from their extraordinary peak and has some reduction to the level of the standing charge and the premium paid by prepayment customers and those paying by cash or cheque.
“But it is still the UK Government who will determine prices in the short term and unless it changes its stance on reducing the value of the level of the energy price guarantee, average bills will increase by £900 a year in April.
“That would mean another 1.7 million more UK households in fuel poverty, up to 8.4 million households. Keeping the EPG at its current level is necessary and affordable. It would avoid unnecessary harm to the most vulnerable in society. UK Government should announce it today.”
What fuel poverty statistics are being released on Tuesday 28th February and do they matter?
The UK Government release new fuel poverty statistics for England only on Tuesday 28 February.
The stats can be found here: https://www.gov.uk/government/collections/fuel-poverty-statistics . There are three main reasons why our projections diverge from our own fuel poverty statistics:
- The UK Government stats are for England only and our estimate is for the whole of the UK
- The UK Gov fuel poverty statistics are time lagged, and relate to 2021-22, before the worst of the energy crisis in the winter of 2022-23
- The way in which fuel poverty is measured is different between the official statistics and NEA’s own measurement. As explained more fully below.
Despite these differences, the LILEE definition of fuel poverty identifies households that are particularly vulnerable in the energy crisis as it captures households who are exposed to very high costs of staying warm at home, while trying to meet these costs on a very low income.
What do the new statistics show?
The new statistics released on Tuesday show the picture of the LILEE definition before the energy crisis in 2022. They that 3.26m households remain in in the LILEE efficiency group – particularly vulnerable to the impacts of the energy crisis. The statistics will also show that the UK Government has made modest progress against the legally binding Fuel Poverty Target for Englandiv (for all fuel poor households to reach EPC C by the end of 2030), and that it would take many decades to meet that target at the current pace of change.
The statistics confirm that that 2020 fuel poverty milestone for England, that all fuel poor households reach EPC E by the end of 2020, with over 160k low income households living in the worst performing properties, with an EPC of F or G.
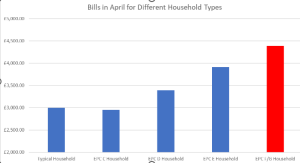
These households, that have been left behind as the UK Government makes slow progress with fuel poverty targets, are massively exposed to high energy prices. At a price cap of £3000 for the typical household, they can expect to pay a premium of more than £1500 just to stay warm at home. In total, we expect that compared to the typical household, fuel poor households in EPC F/G properties will be paying an additional £250m. If the UK Government had met the 2020 fuel poverty milestone, those households would have saved an aggregate of £74m.
What does the UK Government need to do?
National Energy Action can provide a separate briefing on the actions the UK Government should take to offset the worst impacts of the energy crisis for vulnerable households within the upcoming Budget however in short, we, along with a growing number of organisations are calling for the UK Gov to halt the increase of the Energy Price Guarantee to £3,000, so that the typical household pays £2,500/year or less for their energy. This will save low-income households in EPC F/G properties £750/year.
In addition, having left millions of households exposed to this crisis, and 150,000 in the very worst situations, the UK Government must take immediate action to dampen this exposure with further investment for energy efficiency schemes is targeted on low income and vulnerable households to meet legal fuel poverty obligations. This includes ensuring that the planned ECO+ scheme is targeted on low-income households, not those on middle incomes. And meeting the Conservative Party manifesto commitment for Home Upgrade Grants by spending an additional £1.4bn this parliament on energy efficiency measures for off-gas fuel poor households.
On Tuesday 28 February, YouGov publish polling commissioned by NEA that demonstrates strong public support for proposals to prioritise fuel poor and vulnerable households in energy efficiency grant schemes. (See our press release – contact anna.cook@nea.org.uk.


